1

0.27
0.4472
244
2006
2

0.28
0.4504
730
2006
(x)
3

2.66
0.4755
445
1970
(x)
4

-1.52
2.9729
100
1988
(x)
1519
|
Noha a kvarc órák alacsonyabb járáseltérése miatt pontosságukat általában a havi méréssel ellenörzöm, néhány különleges kvarcórát napi méréssel is ellenörzöm. Elsösorban korai kvarcórákat, nelyek napi járáseltérése még közel van a mechanikus órákhoz, illetve a Seiko kvarc-mechanikus hibrid óráját soroltam ide. |
Although due to the lower deviation of the quartz watches monthly measurement is taken, I measure some special quartz watches on daily basis. First of all the early quartz watches. Their daily deviation is similar to the mechanical watches. I have put in this category the quartz-mechanical hybrid waych of Seiko as well. |
| No. | __ | Watch | Daily avg. | Daily st. Dev. | Days | Prod. | Caliber | |
1 |
 |
0.27 |
0.4472 |
244 |
2006 |
|
||
2 |
 |
0.28 |
0.4504 |
730 |
2006 |
(x) |
||
3 |
 |
2.66 |
0.4755 |
445 |
1970 |
(x) |
||
4 |
 |
-1.52 |
2.9729 |
100 |
1988 |
(x) |
||
1519 |
||||||||
| No. | __ | Óra | Napi átlag | Napi szórás | Napok | Gyártva | Szerkezet |
|
|
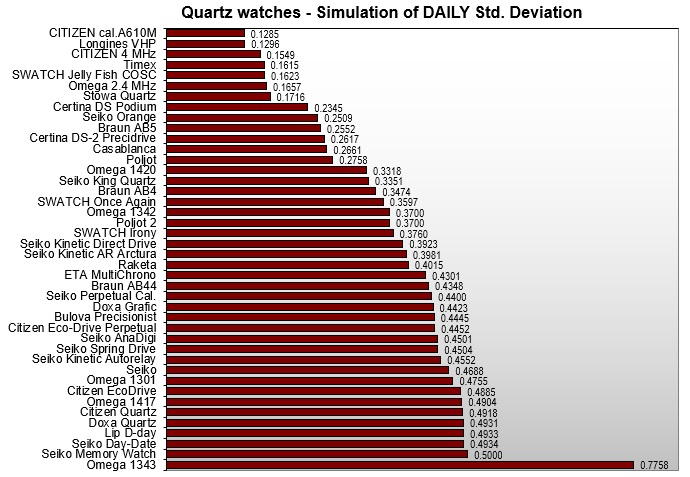
Mivel tapasztlat szerint a kvarcórák eltérése napról-napra nem "ugrál", bizonyos feltételek mellett szimulálhatjuk a napi eltérések szórását is.
|
Since the experience shows that the devation of quartz watches do not oscillate under certain condition we can simulate the standard deviation of the daily deviations.
|

|
| No. | __ | Watch | Daily avg. | Daily st.dev. | Days | ||
1 |
|
0.016 |
0.1282 |
5753 |
QC |
||
2 |
|
0.020 |
0.1296 |
6498 |
QC |
||
3 |
|
0.020 |
0.1549 |
577 |
[QC] |
||
4 |
|
0.020 |
0.1615 |
3164 |
(x) |
||
5 |
|
0.020 |
0.1623 |
2646 |
[QC] |
||
6 |
|
0.020 |
0.1657 |
790 |
[QC] |
||
7 |
|
0.030 |
0.1716 |
396 |
(x) |
||
8 |
|
0.058 |
0.2360 |
4503 |
|
||
9 |
|
0.070 |
0.2509 |
2573 |
(x) |
||
10 |
|
0.070 |
0.2545 |
2285 |
|
||
11 |
|
0.070 |
0.2552 |
972 |
(x) |
||
12 |
|
-0.080 |
0.2661 |
731 |
(x) |
||
13 |
|
0.020 |
0.2758 |
761 |
(x) |
||
14 |
|
-0.130 |
0.3318 |
1216 |
(x) |
||
15 |
|
0.010 |
0.3351 |
366 |
(x) |
||
16 |
|
0.140 |
0.3474 |
792 |
(x) |
||
17 |
|
0.120 |
0.3597 |
427 |
(x) |
||
18 |
|
1.100 |
0.3700 |
455 |
(x) |
||
19 |
|
0.160 |
0.3700 |
1644 |
(x) |
||
20 |
|
0.170 |
0.3760 |
1157 |
(x) |
||
21 |
|
0.190 |
0.3923 |
4660 |
(x) |
||
22 |
|
0.200 |
0.3981 |
1492 |
(x) |
||
23 |
|
0.200 |
0.4015 |
1219 |
(x) |
||
24 |
|
0.240 |
0.4301 |
944 |
(x) |
||
25 |
|
0.250 |
0.4348 |
669 |
(x) |
||
26 |
|
0.262 |
0.4400 |
5536 |
|
||
27 |
|
0.265 |
0.4414 |
6802 |
|
||
28 |
|
0.280 |
0.4501 |
884 |
(x) |
||
29 |
|
0.280 |
0.4504 |
730 |
(D) |
||
30 |
|
0.283 |
0.4510 |
4200 |
|
||
31 |
|
0.270 |
0.4510 |
4081 |
(x) |
||
32 |
|
0.290 |
0.4552 |
2312 |
(x) |
||
33 |
|
0.326 |
0.4688 |
7236 |
|
||
34 |
|
2.660 |
0.4755 |
445 |
(D) |
||
35 |
|
0.390 |
0.4885 |
2071 |
(D) |
||
36 |
|
0.600 |
0.4904 |
1248 |
(x) |
||
37 |
|
0.410 |
0.4918 |
518 |
(x) |
||
38 |
|
0.580 |
0.4931 |
643 |
(x) |
||
39 |
|
0.420 |
0.4933 |
642 |
(x) |
||
40 |
|
0.580 |
0.4934 |
579 |
(x) |
||
41 |
|
0.520 |
0.5000 |
883 |
(x) |
||
42 |
|
-0.460 |
0.7758 |
517 |
(x) |
||
86017 |
|||||||
| No. | __ | Óra | Napi átlag | Napi szórás | Napok |
|
|
|
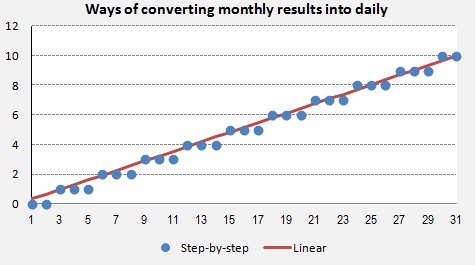
Az alábbi ábrán a vízszintes tengelyen egy hónap napjai láthatóak. A függöleges tengelyen az átszámított értékek vannak. A ferde vonal a lineáris konverziót mutatja. A Pontok a lépcsözetes elosztási módszert mutatja. |
On the chart below on the horizontal axis are the days of a month. On the vertical axis the converted daily deviation values. The line represents the linear method of distribution. The points show the step-by-step method. |

|
|
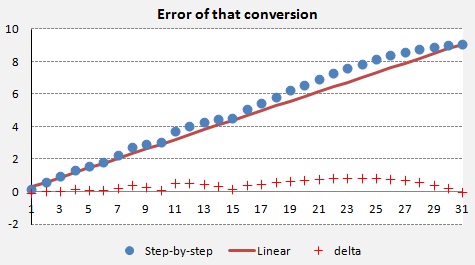
Vizsgáljuk meg, hogy mekkora hibát követünk el a lépcsös elosztással. 31 esetre kiszámítottam a két módszeböl adódó szórást. Az alábbi ábrán a vízszintes tengelyen a vizsgált esetek havi eltérései láthatóak. A függöleges tengelyen az átszámított értékekböl számított szórások vannak. A ferde vonal a lineáris konverziót mutatja. A Pontok a lépcsözetes elosztási módszert mutatja. A plusz jelekkel rajzolt görbe az elözö két görbe különbsége azaz a módszerek különbsége. |
Let us see how large error we commit by using step-by-step method. I have calculated for 31 cases the standard deviations resulting from the two methods. On the chart below on the horizontal axis are the monthly deviations of the tested cases. On the vertical axis are the standard deviation values calculated from the converted values. The slant line shows the linear method. Points represent the step-by-step conversion method. The curve displayed by plus signs shows the difference of the two curves thus the two methods. |

|
| Miért nem a lineáris módszer? | Why not to use linear method? |
|
|