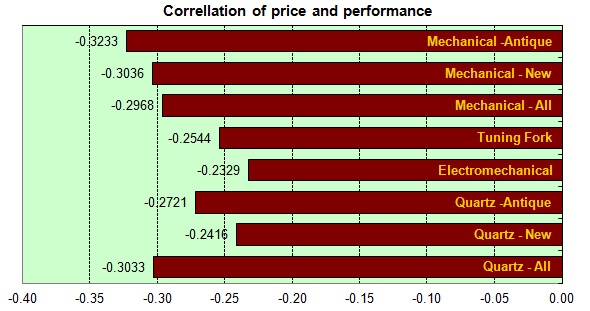
| Category | Kategória | Tested watches Mért órák |
Test values Mérési eredm. (db) |
Correlation Korreláció |
15 |
3666 |
-0.3233 |
||
28 |
8033 |
-0.3036 |
||
44 |
12983 |
-0.2968 |
||
15 |
2149 |
-0.2544 |
||
8 |
1177 |
-0.2329 |
||
28 |
811 |
-0.2721 |
||
13 |
608 |
-0.2416 |
||
41 |
1489 |
-0.3033 |

|
|
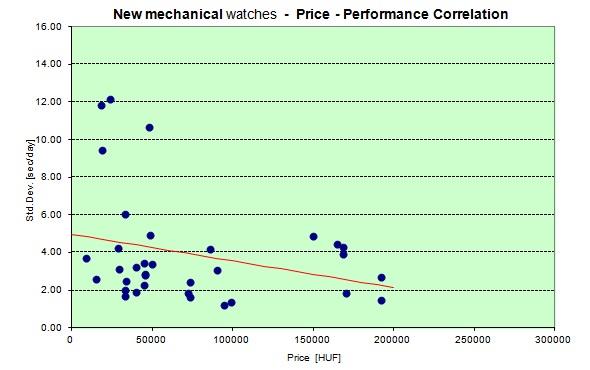
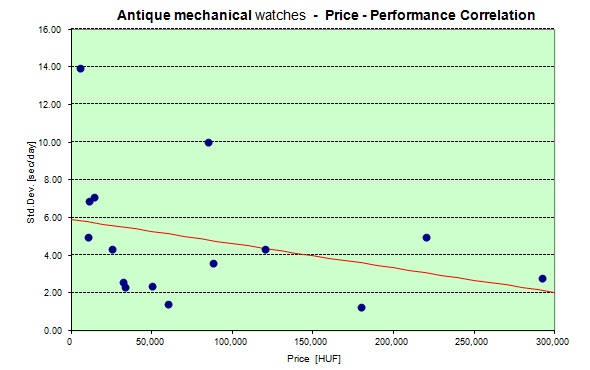
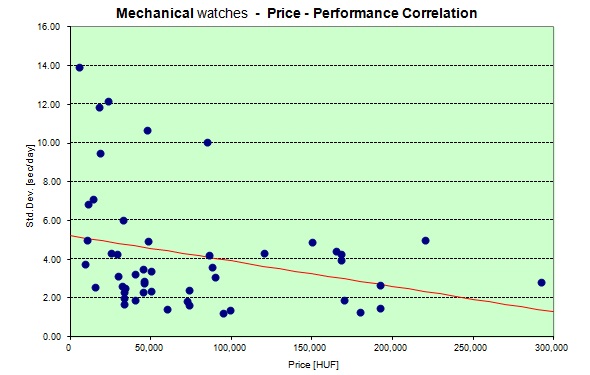
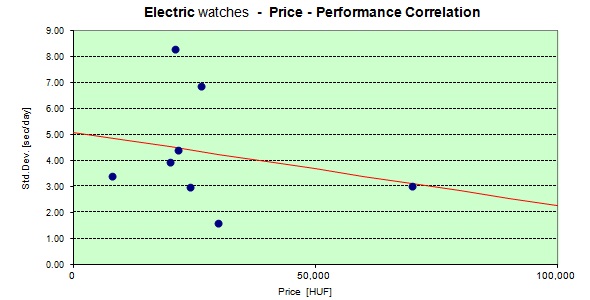
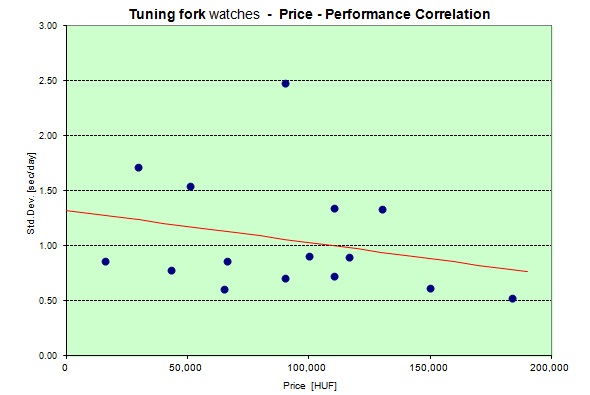
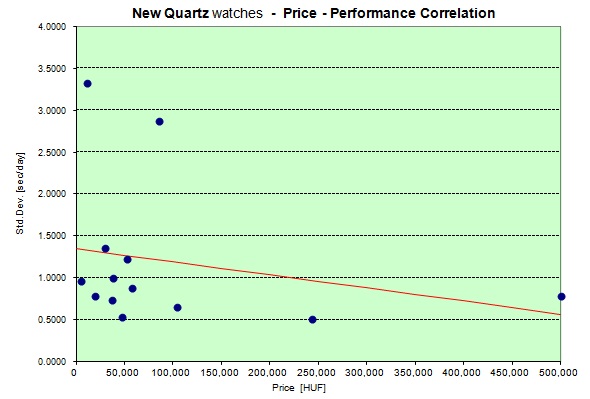
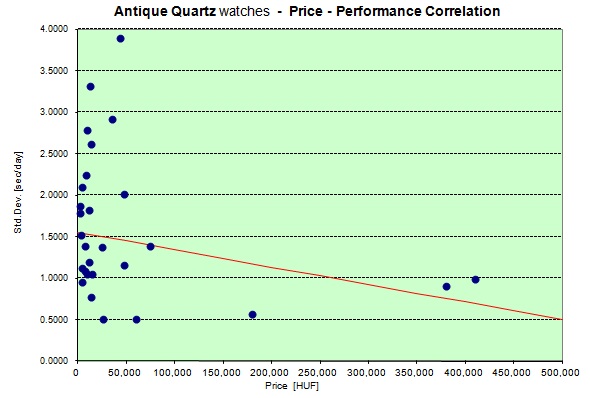
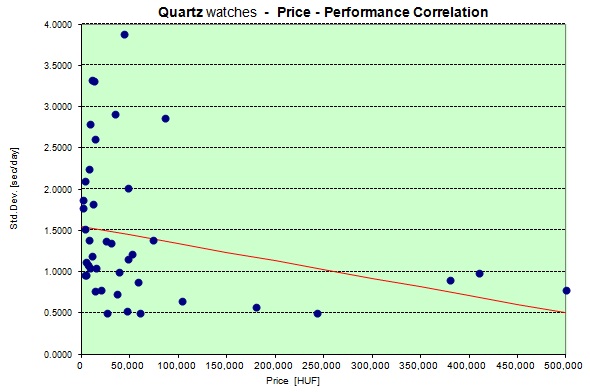
Korreláció - statisztika: annak a mértéke, hogy két, vagy több tulajdonság, vagy mérési sorozat eredménye tendencia jelleggel együtt mozog. (Részletesebben a Wikipédián). Mit is vizsgálunk? Egyszerüsitve a mért órák napi (kvarcoknál havi) járáseltéréseinek korrigált tapasztalati szórását tekintem a pontosság (teljesítmény) jellemzöjének. Minden óránál veszem ezt és a beszerzési árat (ezt esetleg megnövelve a jelentösebb karbantartások árával). Az ezekböl képzett adatsorok korrelációját számítom ki. A szemléletesség kedvéért ezeket a pont halmazokat és a számitás eredményeként meghatározott trend vonalakat megjelenítem. Az eredmények értelmezése. Mivel a választott teljesítmény jellemzö, a korrigált tapasztalati szórás a napi eltérések ingadozását, tehát egyfajta hibát mér, az értékelés szempontjából kedvező, ha magasabb árakhoz kisebb szórás tartozik, azaz a trend csökkenö. Ez negatív korreláció értékkel jár. A korreláció értéke -1 és 1 közé esik. Amint fent említettük előjele a trend irányát határozza meg. Abszolút értéke, ami 0 és 1 közé esik a kapcsolat erösségét jellemzi. Statisztikában az alábbi értékelést használják
Kis leegyszerüsítéssel azt mondhatjuk, hogy a vizsgált órák körében nincs értékelhetöen erös kapcsolat az ár és a teljesítmény között. Az eredmények esetleges általánosítása. Komoly vita tárgya lehet, hogy a vizsgált órák mennyire jellemzik a jelen és múlt óragyártását, illetve az órapiacot.
Az a megállapítás, hogy az órák ára és teljesítméntye között nincs értékelhetö korreláció úgy tünik általásnosan érvényes. |
Correlation - statistics: the degree to which two or more attributes or measurements on the same group of elements show a tendency to vary together.
(More details on Wikipedia). What do we study? On a bit simplified way I regard the standard deviation of daily deviations as the indicator of accuracy (performance) od the watch. At each tested watch take that value and the purchase price (possible increased with the price of major overhauls). Then calculate the correlation of those data vectors. For clarity I display these points and the trend lines defined as the result of the above mentioned calculations. Evaluation of results. The selected performace indicator the stabdard deviation characterizes the variation of the daily deviations what is a kind of an error. That is why from the evaluator's point of view it is positive if higher prices go with lower standard deviation thus the trend is decreasing. That trend is expressed by negative correlation value. Correlation values may vary between -1 and 1. As we have seen the sign of the value decides the direction of the correlation. Its absolute value what falls into 0,1 interval shows the streght of the link. In statistics the following notions are used
A bit simplifying it can be told that among the tested watches there is no significant relationship between price and performance. Possible genralization of the results. It can be subjecct of serious dispute whether the tested watches represent well the watch production of present and past or the watch market.
That statement that the link between price and perfoormance of watches is weak seems to be generally true. |
|
|
|
|